Matplotlib
업데이트:
개요
데이터를 시각화 한다면 데이터에서의 이상치나 분석을 하는데 더욱 용이하기 때문에 matplotlib은 요긴하게 사용될 수 있다. 함수를 그려주는 라이브러리로는 MATLAB 또한 존재하는 것으로 알고있는데, 꼭 MATLAB을 써야 하는 상황이 아니라면 matplotlib을 사용한다는 의견이 대다수 였다.
matplotlib을 사용하기 위해서는 다음과 같이 import를 해줘야한다.
from matplotlib import pyplot as plt
#or
import matplotlib.pyplot as plt
#이쪽이 훨씬 간편하다
import에 있어서 바로 ‘import matplotlib’가 아니라 matplotlib.pyplot과 같이 사용하는 것이 잊어버리기 쉬울 것 같아 정리해 놓았다.
import하는 방법을 알아보았으니 바로 주요 함수에 대해 정리했다.
주요 함수
plt.plot(x,y)
plt.plot은 정수 x, y를 받아들여 x축과 y축을 그린다.
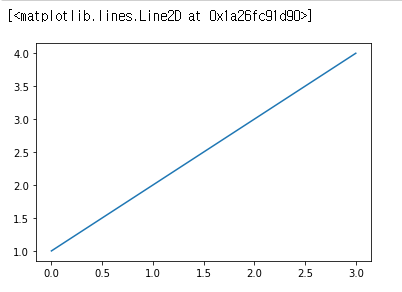
list 형을 하나만 넣어준다면 이 안의 값들을
y값으로 그려내고, x값으로는 자동으로 이에 맞는 x값 [0, 1, 2, 3] 값을 생성한다.
plt.plot([1,2,3,4])
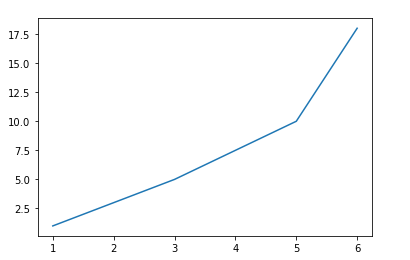
다음은 x 값을 추가해준 코드이다.
plt.plot([1, 2, 3, 5, 6], [1, 3, 5, 10, 18])
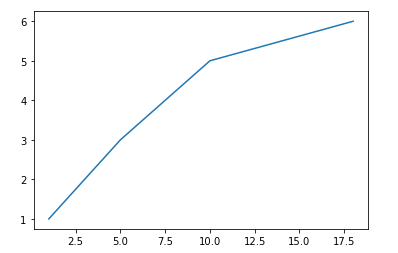
이해를 돕기 위해 반대로도 적용해 보았다.
plt.plot([1, 3, 5, 10, 18],[1, 2, 3, 5, 6])
Graph colors, line style, markers
x,y에 대한 리스트 이외로 세번째 인자를 줘서 다른 옵션을 줄 수 있는데, 그 인자의 종류로는 아래가 있다.
Color
| Colors | Factor |
|---|---|
| blue | ‘b’ |
| green | ‘g’ |
| red | ‘r’ |
| cyan | ‘c’ |
| magenta | ‘m’ |
| yellow | ‘y’ |
| black | ‘k’ |
| white | ‘w’ |
Line Style
| Description | Factor |
|---|---|
| solid line | ’-‘ |
| dashed line | ’–’ |
| dash-dot line | ’-.’ |
| dotted line | ’:’ |
Marker
| Description | Factor |
|---|---|
| point marker | ’.’ |
| pixel marker | ’,’ |
| circle marker | ‘o’ |
| triangle_down marker | ‘v’ |
| triangle_up marker | ’^’ |
| triangle_left marker | ’<’ |
| triangle_right marker | ’>’ |
| tri_down marker | ‘1’ |
| tri_up marker | ‘2’ |
| tri_left marker | ‘3’ |
| tri_right marker | ‘4’ |
| square marker | ’s’ |
| pentagon marker | ‘p’ |
| star marker | ‘*’ |
| hexagon1 marker | ‘h’ |
| hexagon2 marker | ‘H’ |
| plus marker | ’+’ |
| x marker | ‘x’ |
| diamond marker | ‘D’ |
| thin_diamond marker | ‘d’ |
| vline marker | ’|’ |
| hline marker | ‘_’ |
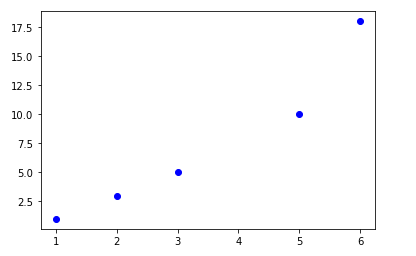
세번째 인자 값으로 ‘bo’를 준다면 파란색 원형 마커로 표시된다.
plt.plot([1, 2, 3, 5, 6], [1, 3, 5, 10, 18], 'bo')
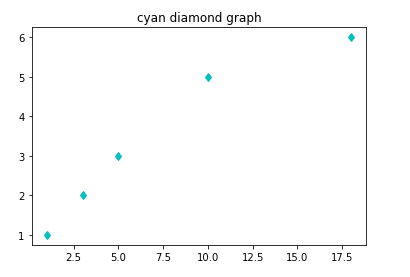
title(‘title name’)
그래프의 제목을 정해줄 수 있다.
plt.title("cyan diamond graph")
plt.plot([1,3, 5, 10, 18],[1,2, 3, 5, 6],'cd')
plt.ylabel(‘labelname’)/ plt.xlabel(‘labelname’)
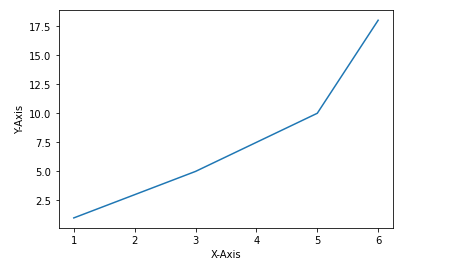
xlabel, ylabel로 각 축의 이름을 설정해 줄 수 있다.
plt.plot([1, 2, 3, 5, 6], [1, 3, 5, 10, 18])
plt.xlabel('X-Axis')
plt.ylabel('Y-Axis')
plt.show()
xticks(list), yticks()
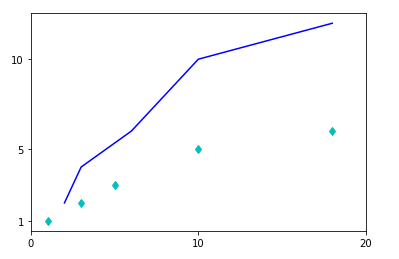
xticks와 yticks는 x축, y축 별로 원하는 눈금을 그릴 수 있게 한다.
plt.plot([1,3, 5, 10, 18],[1,2, 3, 5, 6],'cd')
plt.plot([2, 3, 6, 10, 18],[2, 4, 6, 10 ,12],'b-')
plt.xticks([0, 10, 20])
plt.yticks([1, 5, 10])
bar(x, y)
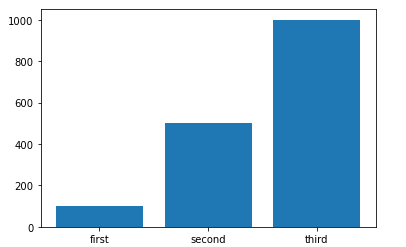
정해놓은 x축 위에 y높이 만큼의 그래프를 그려준다.
xticks와 함께 사용하면 보기 좋을 것이라는 생각을 했다.
x = np.arange(3)
counts = ['first', 'second', 'third']
val = [100, 500, 1000]

plt.bar(x, val)
plt.xticks(x, counts)
plt.show()
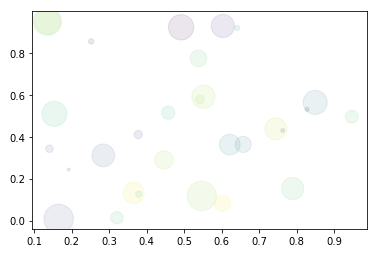
scatter(x, y)
plt.scatter(x, y)는 산점도를 그려준다.
옵션으로는 마커의 면적을 정해주는 s 옵션, 각 점에 색깔을 부여하는 c 옵션, 투명도를 정해줄 수 있는 alpha 옵션이 있다.
N = 30
x = np.random.rand(N)
y = np.random.rand(N)
colors = np.random.rand(N)
area = (10 * np.random.rand(N))**2
plt.scatter(x,y, c= colors s = area alpha = 0.1)

댓글남기기